Who might need help before the exam?
This tool helps teachers choose which students to talk to first, using past school and study records. Teachers review the list and decide what help to offer.
An early version, built and tested on 100,000 saved exam records.

Teachers have limited time. Students still need help.
A teacher may only have time for a few check-ins or tutoring sessions, and waiting for exam results can mean finding a problem too late. This tool suggests who to talk to first, so that limited time goes further.
How it works
-
It reads past records
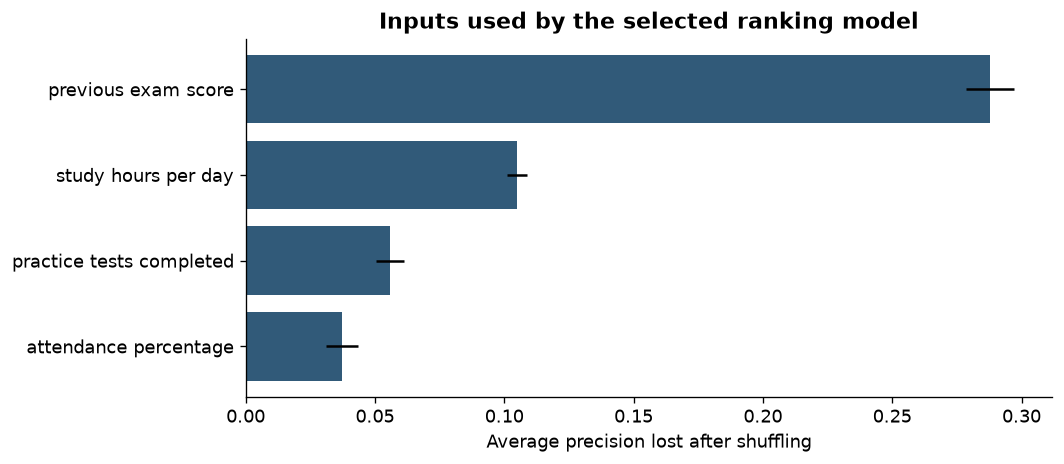
Previous results, attendance, completed assignments, and study habits. These must come from before the exam.
-
You say how many students you can help
If you have time for 25 check-ins, the tool suggests the 25 students who appear most likely to struggle in the exam.
-
A teacher reviews the list and offers help
The tool only suggests. Teachers look at each student’s situation and decide what to do. Students can also ask for help without being on the list.
Did it pick the right students?
We tested the tool on 20,000 saved exam records that were not used to build it or choose it. For each student, we asked: did they later fail the exam? Try different list sizes below.
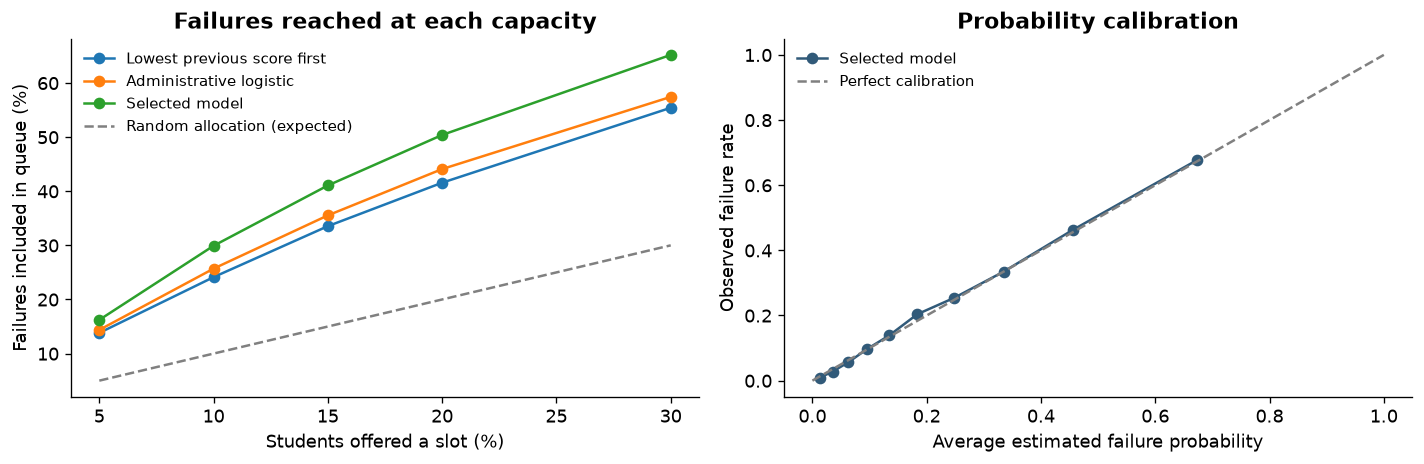
Of the students on each list, how many later did not pass?
This tool included 191 more students who later did not pass, using the same 2,000 places.
How to read this
Both lists have the same number of places. The simpler list uses past results, attendance, and completed assignments. This tool also uses study records. An exam score below 50 counts as not passing, matching the labels in the file.
What this does not show
Even the better list is not complete: 3,169 students who did not pass were still outside it, so teachers need other ways to offer help too.
This was a check using saved records. No students were contacted, and it does not show that the tool improved anyone’s exam results.
Want more detail?
A little more about these numbers
67.7% of students on this tool’s list later did not pass, and 29.9% of all students who did not pass were included on it.
These are estimates from these records. When we repeated the calculation with different samples of the test records, the share who did not pass on the 10% list was about 66%–70% (a 95% uncertainty range).
Open the full results tableHow we checked the tool
We split the 100,000 records into separate groups: 60,000 to learn patterns, 10,000 to adjust its risk estimates, 10,000 to choose the tool, and 20,000 for the final check.
The tool never sees the current exam’s results or answers when making its list. Gender and family income are also left out. We checked results across groups, but those checks do not guarantee fair decisions in every school.
Every approach was allowed the same number of places. The full analysis shows other comparisons and the checks behind the result.
Read the full analysisCharts and details for technical readers
The selected method is calibrated logistic regression. On the final test, ROC AUC was 0.818 and the Brier score was 0.1329. Definitions, model comparisons, group checks, and uncertainty estimates are in the notebook.
Run the tool on your computer
Use a CSV table with the required columns and records from before the exam. This example creates a list of 25 students for a teacher to review.
python score_students.py \
  --input pre_exam_snapshot.csv \
  --slots 25 \
--output teacher_worklist.csvA school would need to try it carefully.
A better list could help staff use their time well. A school would still need to check whether the help actually improves students’ results. Three things to do first:
-
Check where the records came from
The source and dates of this file are unverified. A school must confirm that its own records are reliable and were collected before the exam.
-
Test it on a later exam
Results from this file may not carry over to another school or a future exam. Start with a small local trial and keep teachers in charge.
-
Check whether the help works
Track who receives help, how students do afterward, staff time, and cost. This project has not measured better grades or money saved.
Background reading: IES guide on checking progress and offering help and EEF guide to one-to-one tutoring.
Want to see the work?
The full analysis, code, and instructions are available here.
Download the notebook
The analysis and Python code in one document. Upload it to Kaggle and add a copy of the source CSV you are allowed to use.
See the code on GitHub
The code, result tables, and steps to repeat the analysis.
Download the full project
The notebook, trained tool, result tables, and instructions. The original student CSV is not included.